

Belgium / Netherlands: Budgetary clash between two meal cultures
- Amaury Marescaux

- Dec 10, 2025
- 3 min read
Updated: Dec 19, 2025
INSIGHT - Belgians spend more on food than their Dutch neighbors. This budget gap stems not only from cultural choices ("home cooking" vs. "convenience") but also from economic factors. That said, the out-of-home food market could become one of the most dynamic in Belgium.

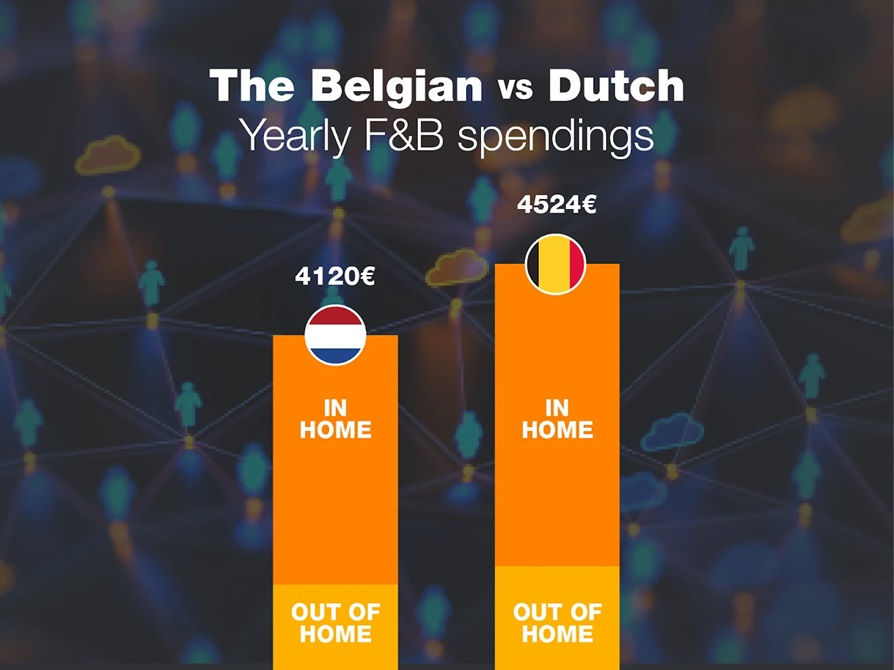
Belgians currently spend an average of 377 euros per month on food and drink, or approximately 4,524 euros per person per year. Based on the average Belgian household size (2.25 people), this represents over 10,000 euros per household spent annually on food and drink.
Behind these figures lies a cultural and economic reality: spending is increasing, but behaviors remain marked by caution and the search for value.
70% of the budget remains at home
Over 70% of food spending is still for home consumption, amounting to approximately €39 billion. Supermarkets, grocery stores, and local outlets remain the cornerstones of the Belgian food budget.
Cooking at home, sharing a meal at home, or entertaining are still deeply ingrained habits in the country's culture. The search for quality, enjoyment, and fair prices remains a strong driver of consumer choices.
30% for out-of-home consumption: a market worth 15 billion euros
Out-of-home consumption (restaurants, cafes, service stations, canteens, and delivery) represents approximately 30% of the total, or €15 billion. The market is experiencing continuous growth, but this is fueled by prices while volumes are under pressure. Restaurateurs must contend with rising staff and supply costs while maintaining affordable prices.
Consumers, for their part, remain attentive: eating well, at a reasonable price, in a friendly setting remains the priority.
A Dutch culture of "convenience"
In 2024, the Dutch spent €4,120 per year on food and drinks, a lower level than the Belgians. But their habits differ. In the Netherlands, the share of foodservice is growing faster, driven by a "convenience" culture: ready-to-eat meals, fast food, and delivery.
While delivery has established itself as a real growth driver in the Netherlands (around 16% of foodservice turnover, according to Food Inspiration), its weight remains much more modest in Belgium, where it represents around 3% of the foodservice market .
The cost of living in Belgium is generally higher than in France or the Netherlands. Several factors explain these higher prices. Inflation (admittedly, not only in Belgium), taxes, and labor costs, which are particularly high in the country, increase the expenses of restaurant owners and force them to pass these costs on to their customers. The VAT rate on ready-to-eat meals is 12% in Belgium compared to 10% in France.
As for hourly labor costs, Belgium is in the top 3 of the countries where they are the highest, after Luxembourg and Denmark.
The phenomenon is growing, but without disrupting the existing balance: Belgian consumers still prioritize the experience of a sit-down meal, while their Dutch neighbors place more emphasis on convenience and speed. In Belgium, dining out remains primarily a social and high-quality experience , where the overall experience, service, and conviviality take precedence over speed.
Towards a new balance?
Experts anticipate growth in out-of-home dining in the coming years, driven by the emergence of new formats (coffee corners, grab & go, food courts) and the modernization of service stations . And while the foodservice sector currently accounts for 30% of the market, rapid growth is possible, as predicted by Food Inspirations in the Netherlands.
In the United States, this ratio already exceeds 50%, proving that structural change is possible. If Belgium follows this trajectory, the out-of-home market could become one of the most dynamic of the decade.


